

Georgia's Early Vote Passes 2.1 Million: A Look at Who Has Voted
Through Tuesday, Oct. 27, 2,128,281 Georgians have an accepted ballot. Here's how they voted, where they live and how turnout breaks down across the six groups of the CivicBubble™ party model.
October 28, 2026 · By CivicBubble™
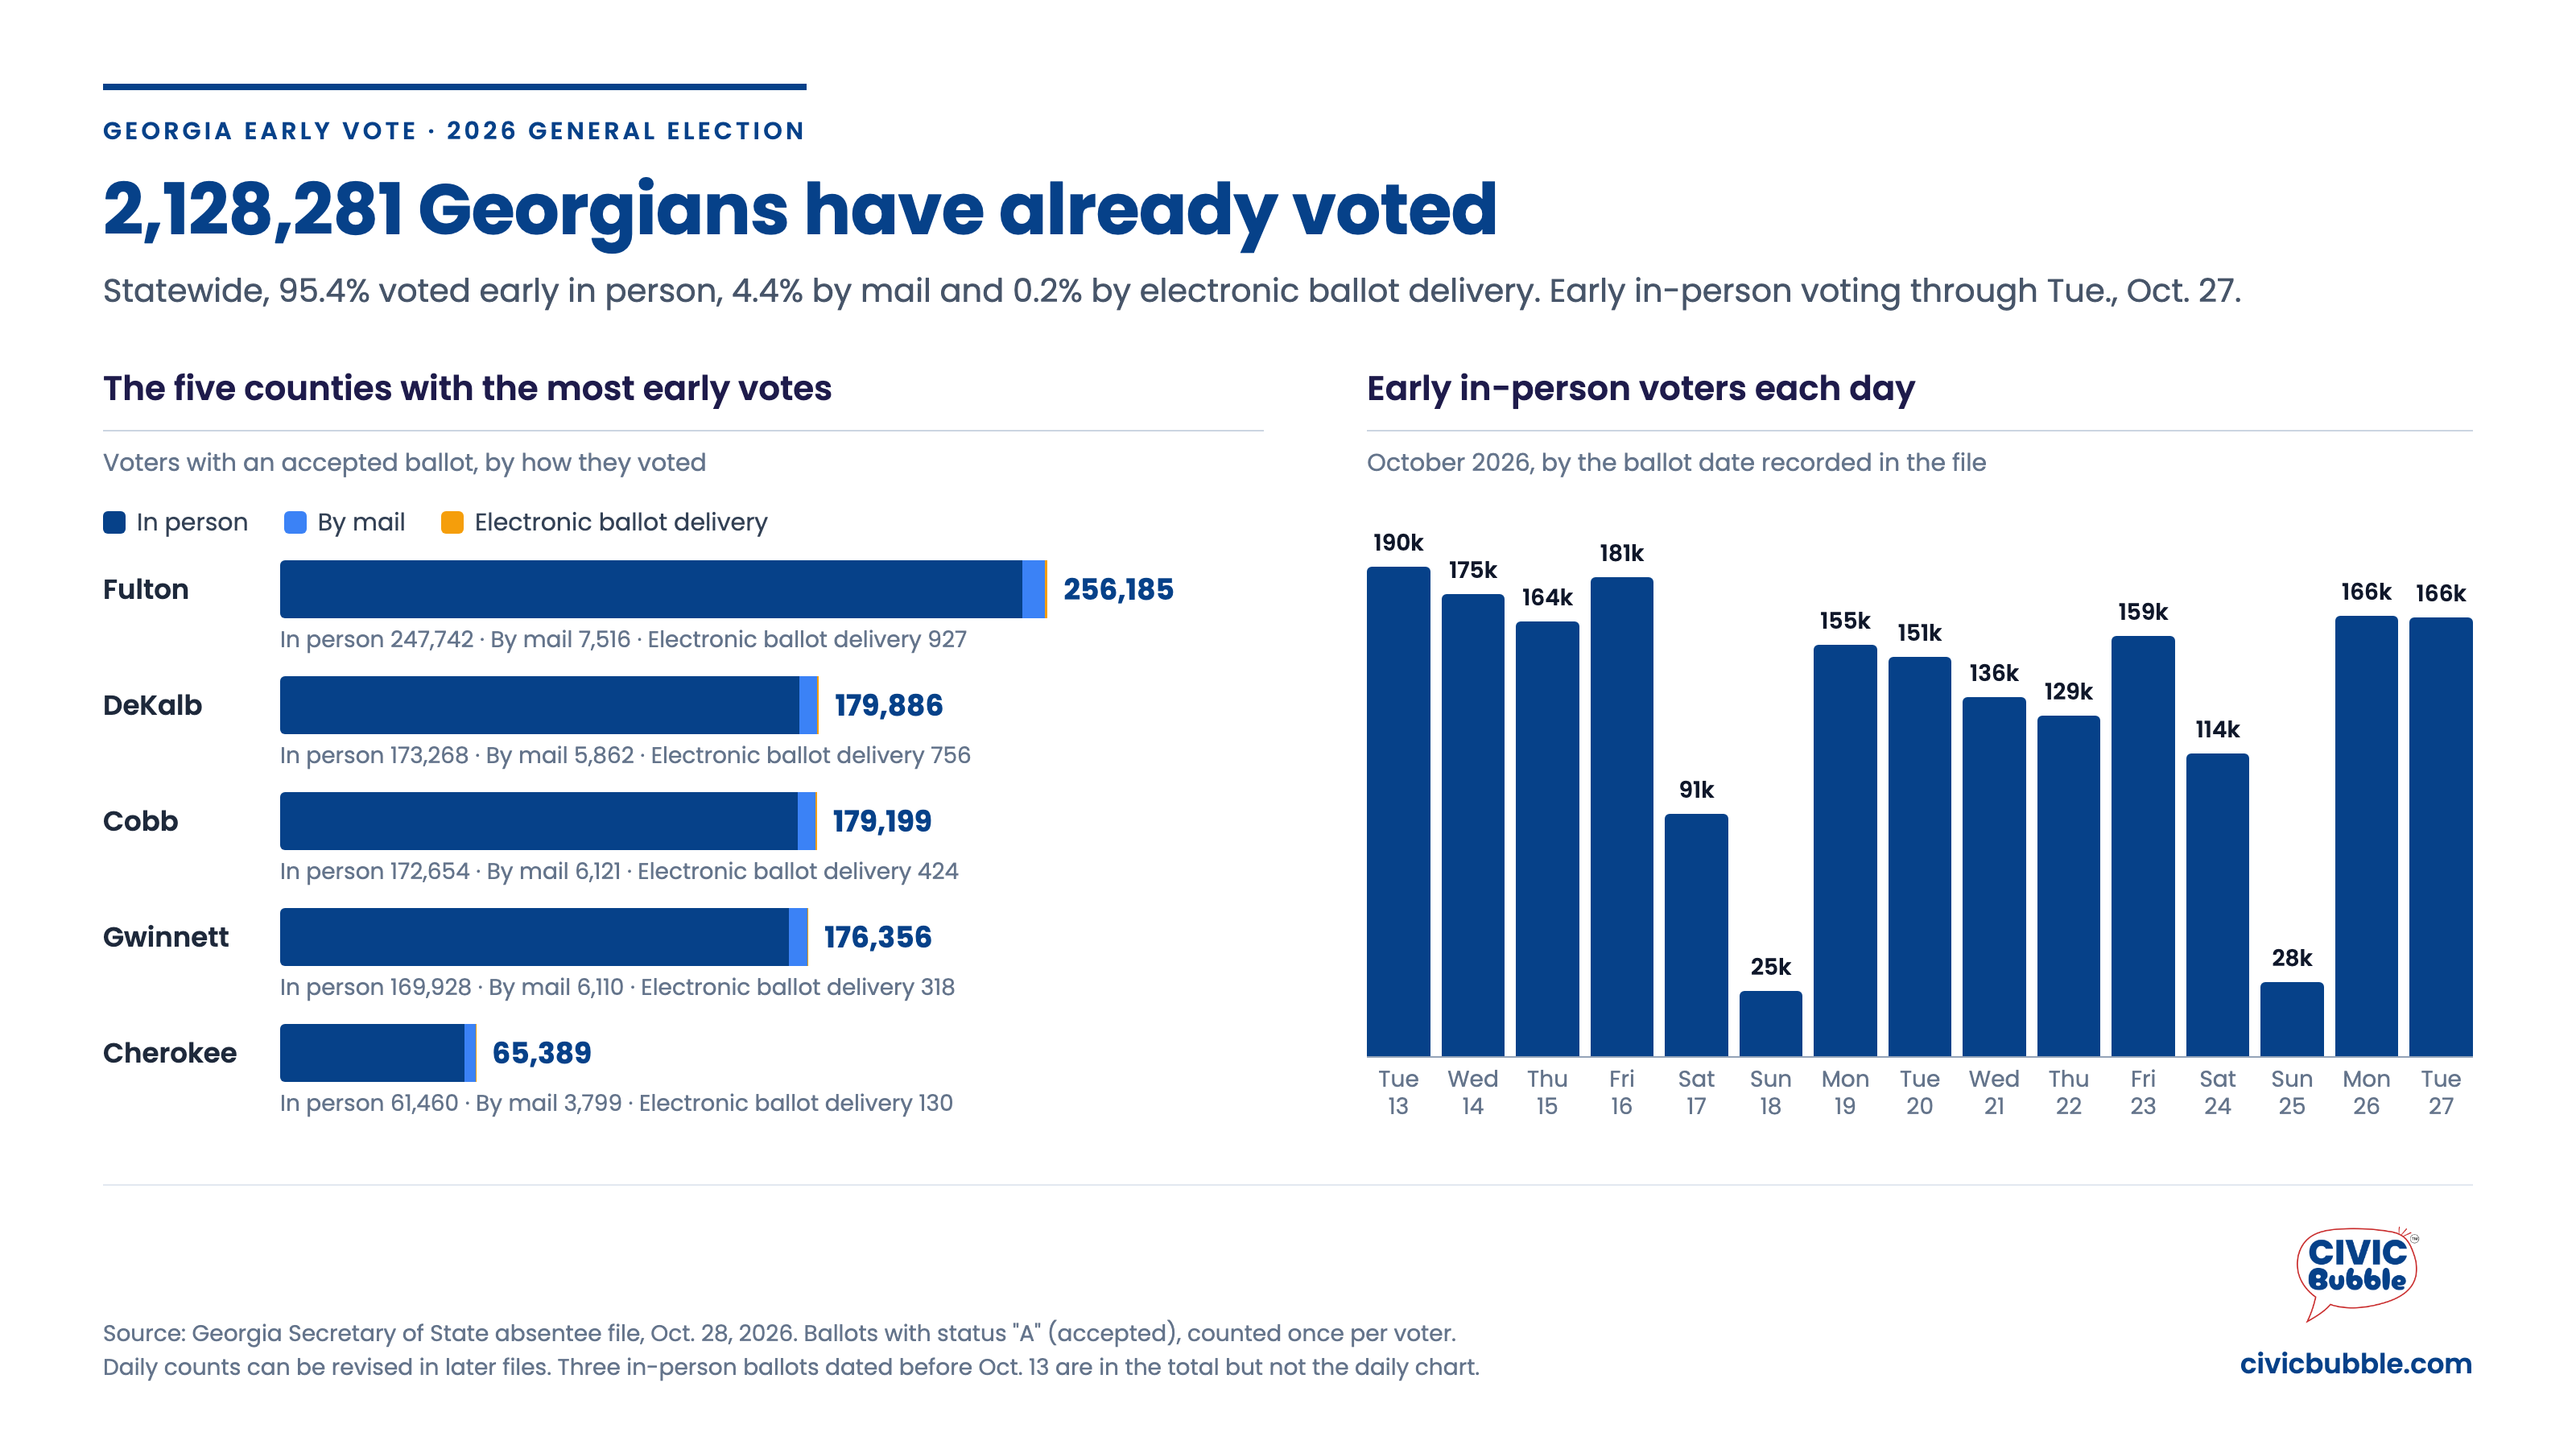
A CivicBubble™ data brief. Voting figures through Tuesday, Oct. 27. from last Secretary of State update: Wednesday, Oct. 28, 2026 - 8:18 AM.
Key findings
2,128,281 Georgians have an accepted ballot. 95.4% of them voted early in person.
Turnout is higher among voters modeled as Democrats. 53% of them have voted so far, compared with 40% of voters modeled as Republicans.
Metro Atlanta holds more than half the early vote. Its 11 core counties account for 52.4% of it.
Where things stand
Georgia's early vote passed 2.1 million this week. The Secretary of State's absentee file from Wednesday morning lists 2,128,281 voters with an accepted ballot, counting early in-person voting through Tuesday, Oct. 27.
That's 173,414 more voters than the file from a day earlier. Early voting runs through Friday, Oct. 30. Election Day is Tuesday, Nov. 3.
How people are voting
In person, by a wide margin. Of the 2,128,281 voters, 2,029,896 cast their ballot at an early-voting site. That's 95.4%. Another 93,931 (4.4%) voted absentee by mail, and 4,454 (0.2%) used electronic ballot delivery.
Electronic ballot delivery isn't online voting. The voter receives a blank ballot electronically, prints it and mails it back. Federal law requires states to offer it to military and overseas voters.
Some ballots are still out. 58,497 voters have a ballot marked as issued but not yet accepted: 52,727 by mail, 5,766 by electronic delivery and 4 in person. You can check your own ballot on the Secretary of State's My Voter Page.
Where the votes are
All 159 Georgia counties have early votes on the books. Fulton leads with 256,185. DeKalb, Cobb and Gwinnett are close behind, each between 176,000 and 180,000.
The 11 Metro Atlanta counties together account for 1,115,673 voters, or 52.4% of the state total. Those counties are Cherokee, Clayton, Cobb, DeKalb, Douglas, Fayette, Forsyth, Fulton, Gwinnett, Henry and Rockdale.
The 10 counties with the most early voters
County | Voters | In person | By mail | Electronic ballot delivery |
|---|---|---|---|---|
Fulton | 256,185 | 247,742 | 7,516 | 927 |
DeKalb | 179,886 | 173,268 | 5,862 | 756 |
Cobb | 179,199 | 172,654 | 6,121 | 424 |
Gwinnett | 176,356 | 169,928 | 6,110 | 318 |
Cherokee | 65,389 | 61,460 | 3,799 | 130 |
Henry | 59,999 | 58,118 | 1,840 | 41 |
Forsyth | 55,597 | 52,796 | 2,676 | 125 |
Clayton | 52,965 | 51,132 | 1,784 | 49 |
Chatham | 50,098 | 46,802 | 3,125 | 171 |
Hall | 40,115 | 37,924 | 2,128 | 63 |
The pace
Opening day is still the busiest. On Tuesday, Oct. 13, 190,396 Georgians voted in person. Since then, weekdays have ranged from 128,536 (Thursday, Oct. 22) to 180,882 (Friday, Oct. 16). Weekends run lighter. Saturdays drew 91,415 and 114,279 voters; Sundays, 24,809 and 28,022.
The first six days brought 826,314 in-person voters and the next seven brought 871,495. The final week then opened with 166,391 on Monday and 165,693 on Tuesday, the biggest days since Oct. 16.
Daily counts can shift a little as counties update their records. Monday's count rose by 550 between the Oct. 27 and Oct. 28 files.
Who is voting
Georgia doesn't register voters by party, so there's no official party count of who has turned out. To get a read, we matched early voters to CivicBubble's party model.
The model places each registered voter in one of six groups, based mainly on public primary voting history: Consistent Democrat, Leans Democrat, Swing, Leans Republican, Consistent Republican and Undetermined. Voters with no qualifying primary ballot in our data are Undetermined. It's an estimate of past leaning. It says nothing about how anyone voted this year.
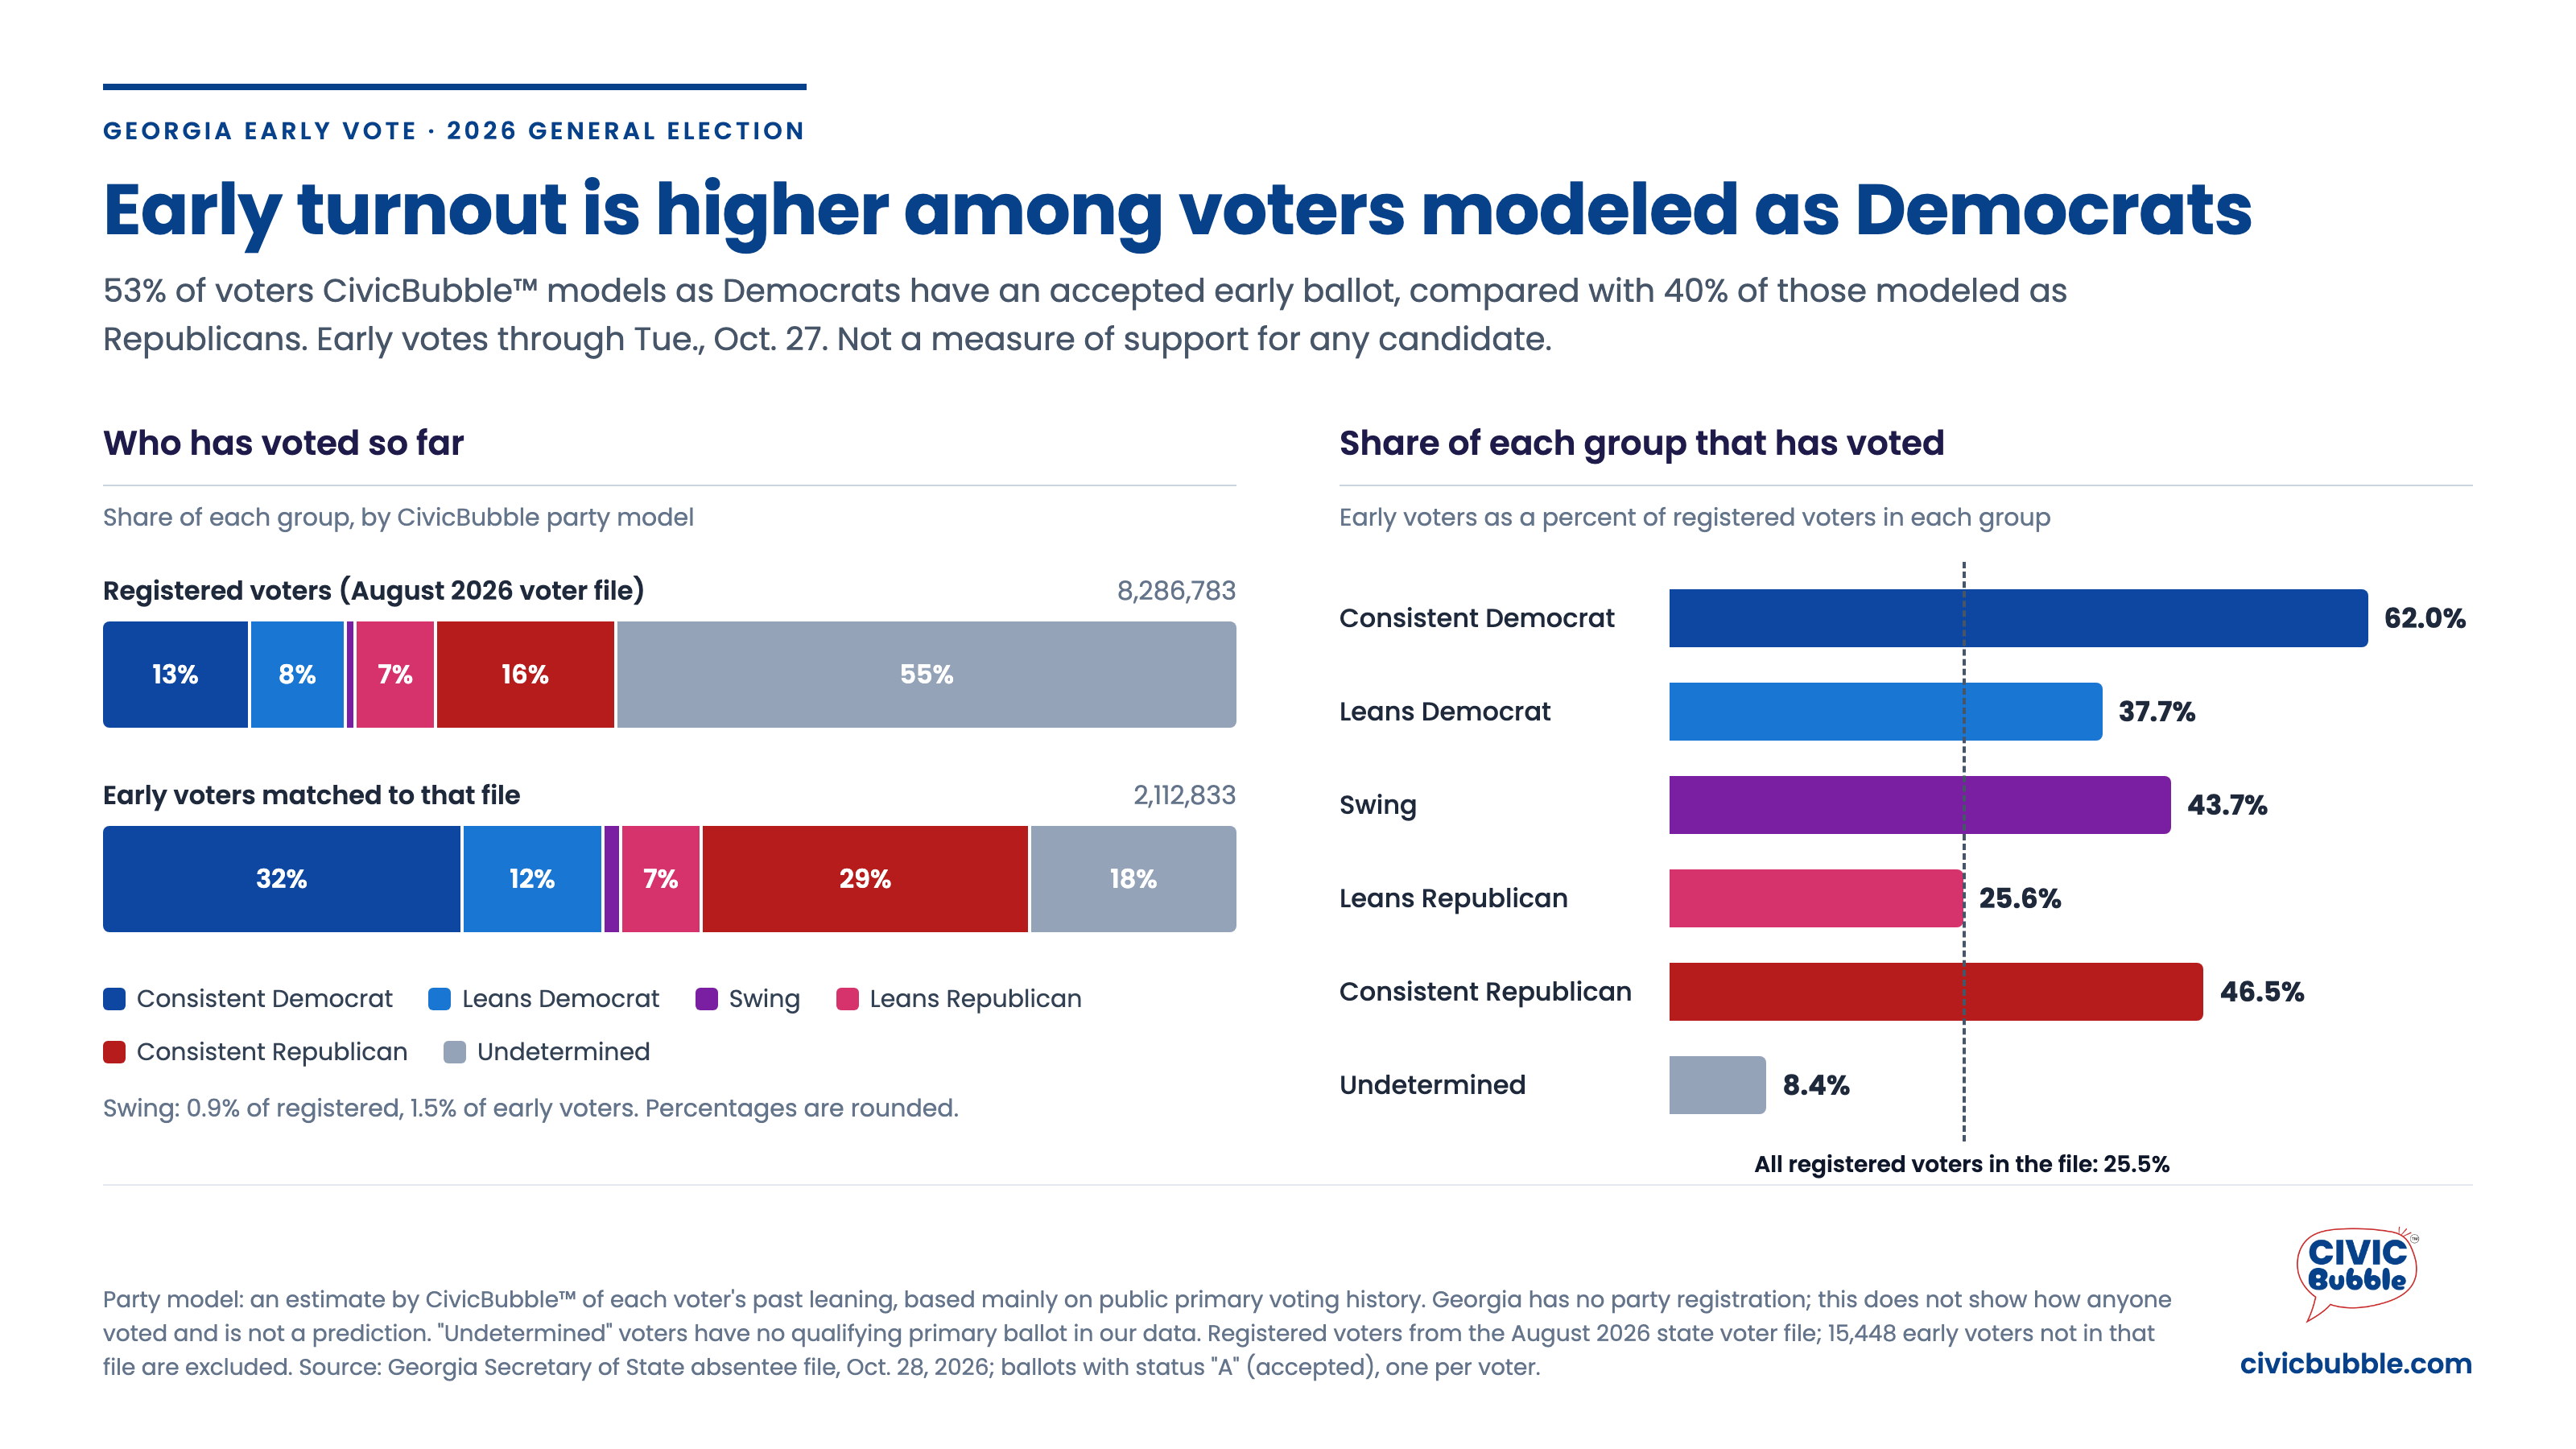
Modeled Democrats are voting at a higher rate. 53% of voters modeled as Democrats have an accepted ballot. Among voters modeled as Republicans, it's 40%. The gap is widest at the ends: 62.0% of Consistent Democrats have voted, compared with 46.5% of Consistent Republicans.
The early vote doesn't mirror the rolls. On the voter rolls, people modeled as Republicans slightly outnumber those modeled as Democrats, 1,903,477 to 1,781,374. Among the 2,112,833 early voters we could match, it flips: 44.3% are modeled as Democrats and 36.1% as Republicans.
Almost one in five early voters is Undetermined. That's 382,540 people, or 18.1% of the matched group. They have no qualifying primary ballot in our data, so the model doesn't place them.
CivicBubble party model | Registered voters | Early voters | Share of matched early voters | Share of group that has voted |
|---|---|---|---|---|
Consistent Democrat | 1,083,470 | 672,063 | 31.8% | 62.0% |
Leans Democrat | 697,904 | 263,294 | 12.5% | 37.7% |
Swing | 74,028 | 32,335 | 1.5% | 43.7% |
Leans Republican | 588,277 | 150,570 | 7.1% | 25.6% |
Consistent Republican | 1,315,200 | 612,031 | 29.0% | 46.5% |
Undetermined | 4,527,904 | 382,540 | 18.1% | 8.4% |
Total in this analysis | 8,286,783 | 2,112,833 | 100% | 25.5% |
What this doesn't tell us
How anyone voted. The model reflects past primary choices, not this year's ballot.
How Nov. 3 will turn out. Different groups may favor different days and ways to vote, including Election Day. Early turnout isn't a forecast.
Anything about voters missing from our match. The groups come from the August 2026 state voter file, and 15,448 early voters aren't in it. They count in the statewide totals above but not in this section.
Journalists are welcome to use these charts with credit to CivicBubble and a link to this page.
How we did this
The data comes from the Georgia Secretary of State's Voter Absentee File for the Nov. 3 general election (file A-12601), downloaded Oct. 28, 2026. Despite the name, it covers all early voting: in person, by mail and electronic. It's updated daily and is separate from the official voter history the state releases after the election.
We counted voters, not rows. A voter counts once if any of their ballots has status "A." We haven't found an official key to the file's status codes. We read "A" as accepted because every such ballot has a return date, while issued, cancelled, rejected and spoiled ballots carry other codes. Daily counts use the date the file records for each in-person ballot. A few ballots carry dates that are clearly typos, like a mail ballot dated 2029. Those are in the totals but not the daily chart.
For the party section, we matched early voters by voter registration number to the August 2026 state voter file and CivicBubble's party model. Before publishing, an independent review recomputed the absentee-file figures from the raw data and checked the party percentages against our database totals.
Early voting continues through Friday, Oct. 30. Find a site near you in our Metro Atlanta early-voting guide. And if you want your districts, officials and elections in one place, the free CivicBubble app maps every district tied to your Georgia address.

Look Up, Keep Up, Speak Up.
The free CivicBubble™ app maps every district tied to your Georgia address — from Congress to City Hall — and turns local news, elections, and officials into one organized feed.